

Wind energy pricing remains attractive to utility and commercial purchasers, according to an annual report released by the U.S. Department of Energy and prepared by the Electricity Markets & Policy Group at Lawrence Berkeley National Laboratory (Berkeley Lab). Prices offered by newly built wind projects are averaging around 2¢/kWh, driven lower by technology advancements and cost reductions.
“Wind energy prices—particularly in the central United States—are at rock-bottom levels, with utilities and corporate buyers selecting wind as the low-cost option,” said Berkeley Lab Senior Scientist Ryan Wiser. “Moreover, enabled by technology advancements, wind projects are economically viable in a growing number of locations throughout the United States.”
Key findings from the U.S. Department of Energy’s reflective “Wind Technologies Market Report” include:
- Wind power represented the largest source of U.S. electric-generating capacity additions in 2015. Wind power capacity additions in the United States surged in 2015, with $14.5 billion invested in 8.6 gigawatts (GW) of new capacity. Wind power constituted 41% of all U.S. generation capacity additions in 2015, up sharply from its 24% market share the year before and close to its all-time high. Wind power currently meets about 5% of the nation’s electricity demand, and represents more than 10% of total electricity generation in twelve states, and more than 20% in three of those states.
- Bigger turbines are enhancing wind project performance. Since 1998-99, the average capacity of wind turbines installed in the United States has increased by 180% (to 2.0 megawatts (MW) in 2015), the average turbine hub height has increased by 47% (to 82 meters), and the average rotor diameter has increased by 113% (to 102 meters). Moreover, turbines originally designed for lower wind speeds are now regularly deployed in higher wind speed sites, boosting project performance. Increased rotor diameters, in particular, have begun to dramatically increase wind project capacity factors. For example, the average 2015 capacity factor among projects built in 2014 reached 41%, compared to an average of 31% among projects built from 2004–2011 and 26% among projects built from 1998–2003.

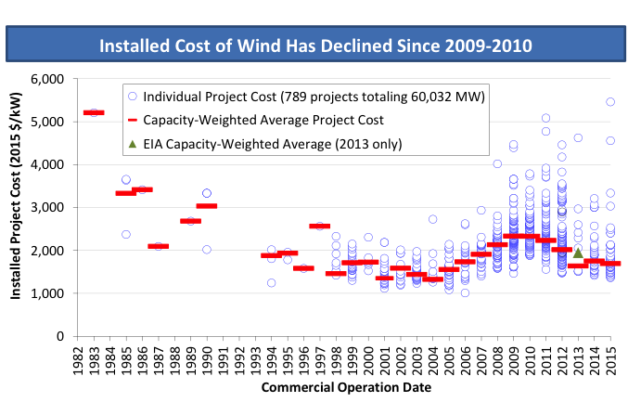
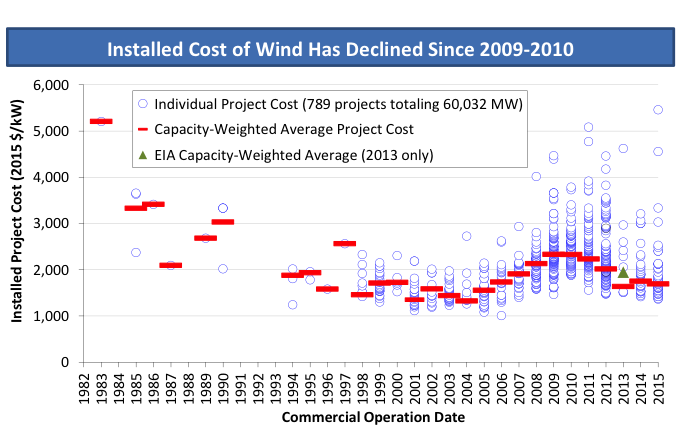
- Low wind turbine pricing continues to push down installed project costs. Wind turbine prices have fallen 20% to 40% from their temporary highs in 2008, and these declines are pushing project-level costs down. Wind projects built in 2015 had an average installed cost of $1,690/kilowatt(kW), down $640/kW from the temporary peak in 2009 and 2010.
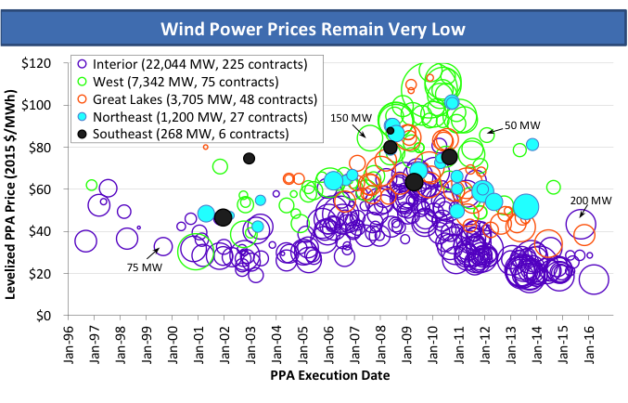
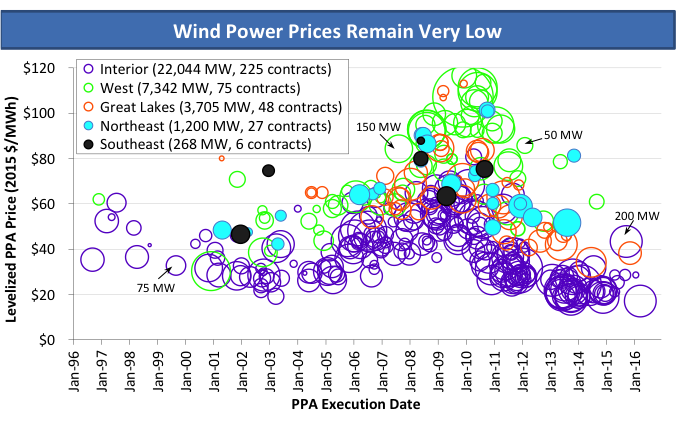
- Wind energy prices remain very low. Lower installed project costs, along with improvements in capacity factors, are enabling aggressive wind power pricing. After topping out at nearly 7¢/kWh in 2009, the average levelized long-term price from wind power sales agreements has dropped to around 2¢/kWh—though this nationwide average is dominated by projects that largely hail from the lowest-priced central region of the country. Recently signed wind energy contracts compare favorably to projections of the fuel costs of gas-fired generation extending out through 2040. These low prices have spurred demand for wind energy, both from traditional electric utilities and also, increasingly, from non-utility purchasers like corporations, universities, and municipalities.
- The manufacturing supply chain continued to adjust to swings in domestic demand for wind equipment. Wind sector employment reached a new high of 88,000 full-time workers at the end of 2015, and the profitability of turbine suppliers has generally rebounded over the last three years. For wind projects recently installed in the United States, domestically manufactured content is highest for nacelle assembly (>85%), towers (80-85%), and blades and hubs (50-70%), but is much lower (<20%) for components internal to the nacelle. Although there have been a number of recent manufacturing plant closures, each of the three major turbine manufacturers serving the U.S. market has one or more domestic manufacturing facilities in operation.
Berkeley Lab’s contributions to this report were funded by the U.S. Department of Energy’s Office of Energy Efficiency and Renewable Energy.
Additional Information:
The full report, 2015 Wind Technologies Market Report, a presentation slide deck that summarizes the report, and an Excel workbook that contains much of the data presented in the report, can all be downloaded from: windreport.lbl.gov
The Department of Energy’s release on this study is available at: energy.gov/windreport
# # #
Lawrence Berkeley National Laboratory addresses the world’s most urgent scientific challenges by advancing sustainable energy, protecting human health, creating new materials, and revealing the origin and fate of the universe. Founded in 1931, Berkeley Lab’s scientific expertise has been recognized with 13 Nobel prizes. The University of California manages Berkeley Lab for the U.S. Department of Energy’s Office of Science. For more, visit www.lbl.gov. The Electricity Markets & Policy Group at Berkeley Lab is online at emp.lbl.gov, and can be followed on Twitter at @BerkeleyLabEMP.
DOE’s Office of Science is the single largest supporter of basic research in the physical sciences in the United States, and is working to address some of the most pressing challenges of our time. For more information, please visit science.energy.gov.