
Berkeley, CA — Solar energy system pricing is at an all-time low, according to the latest editions of two recurring “state of the market” reports released today by the Department of Energy’s Lawrence Berkeley National Laboratory (Berkeley Lab).
Within the market for distributed solar photovoltaic (PV) systems, installed prices in 2015 declined by $0.20-per-watt (W) or 5% year-over-year for residential systems, by $0.30/W (7%) for smaller non-residential systems, and by $0.30/W (9%) for larger non-residential systems. Prices for utility-scale PV systems that came online in 2015 fell by $0.30/W (12%) from the prior year. Preliminary data for the first six months of 2016 suggest that prices have continued to fall within most states and market segments.
These and many other statistics can be found within two new Berkeley Lab reports. Tracking the Sun IX focuses on installed pricing trends in the distributed PV market, including both residential and non-residential sectors. Utility-Scale Solar 2015 focuses on the utility-scale market, describing installed prices, as well as trends related to the design, operating costs, capacity factors, and power purchase agreement (PPA) prices of utility-scale solar projects.
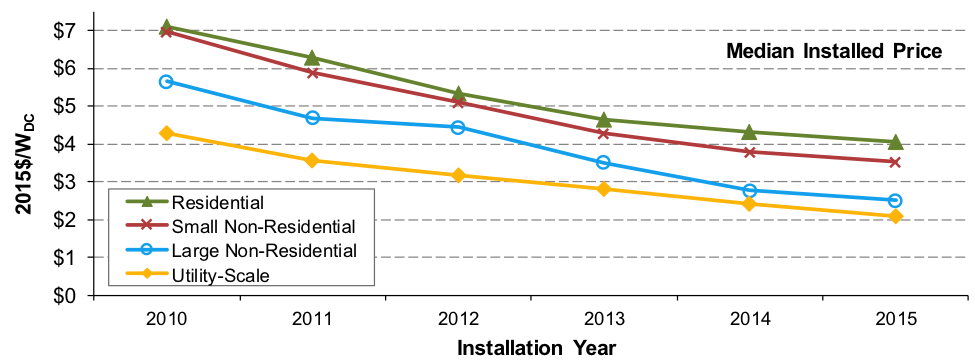 “This marked the sixth consecutive year of significant price reductions for distributed PV systems in the U.S.,” notes Galen Barbose of Berkeley Lab’s Electricity Markets and Policy Group, the lead author of Tracking the Sun. The continued decline is especially noteworthy given the relatively stable price of PV modules since 2012. The report attributes recent system price declines, instead, to reductions in other hardware costs and to solar “soft” costs. The latter includes such things as marketing and customer acquisition, system design, installation labor, and permitting and inspections.
Both reports also highlight the tremendous variability in PV system pricing. For example, among residential systems installed in 2015, 20 percent sold for less than $3.30/W, while another 20 percent sold for more than $5.00/W. As Berkeley Lab’s Naïm Darghouth explains, “This variability reflects a host of factors: differences in system design and component selection, market and regulatory conditions, and installer characteristics, to name a few.”
Utility-scale projects completed in 2015 also vary widely in price, with the cheapest 20 percent priced below $1.60/W, compared to the most expensive 20 percent priced above $2.60/W. Berkeley Lab’s Joachim Seel notes, “Some of the observed price differences between projects can be explained by varying lag times between contract negotiation and project completion, as some of these projects have been under development, or even construction, for several years.”
Project performance
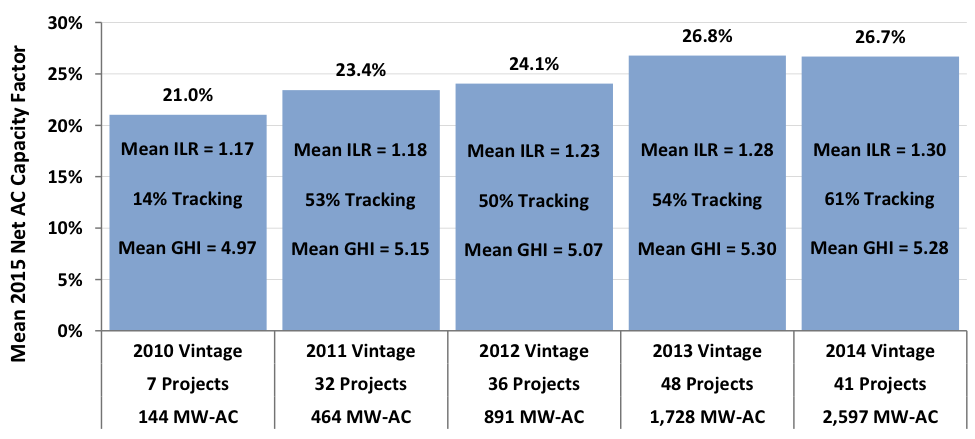
Within the utility-scale sector, PV project performance—as measured in terms of “capacity factor”—has improved among more recently built projects, driven by advances in both technology and project design. In particular, an increasing number of projects are deploying solar tracking technology to boost performance. In addition, developers have been augmenting the size of projects’ solar arrays relative to their inverters (resulting in higher inverter loading ratios, or ILRs), as another way to boost output. Finally, over the past few years, projects have, on average, been built at sites with stronger solar resources, as measured by global horizontal irradiance (GHI).
As shown in the figure below, changes in these three parameters have driven mean capacity factors higher by project vintage over the last four years, to nearly 27% among 2014-vintage projects (whose first full operating year was in 2015).
Power purchase agreement (PPA) pricing
Lower installed project costs and higher capacity factors have enabled levelized PPA prices from utility-scale PV projects to fall dramatically over time, by $20-$30/MWh per year on average from 2006 through 2013, with a smaller price decline of ~$10/MWh per year evident among PPAs signed in 2014 and 2015. As shown in the figure below, most PPAs in the 2015 sample are priced at or below $50/MWh (levelized, in real 2015 dollars), with a few priced as aggressively as ~$30/MWh. According to Berkeley Lab’s Mark Bolinger, “Falling PPA prices have enabled the utility-scale market to expand beyond the traditional strongholds of California and the Southwest into up-and-coming regions like Texas, the Southeast, and even the Midwest.”

Looking ahead, the improving economics of solar power demonstrated in these two reports, coupled with the extension of the 30% federal investment tax credit (ITC) through 2019, should drive a continued expansion in all sectors of the U.S. solar market over the next few years.
Both reports, along with accompanying slide decks and data files, can be downloaded for free from trackingthesun.lbl.gov and utilityscalesolar.lbl.gov.
In addition, the extensive underlying database of project-level data developed for Tracking the Sun is available to the public and can be downloaded through the National Renewable Energy Laboratory’s Open PV Project.
Highlights of both reports will be presented through two separate webinars:
Tracking the Sun IX
Wed, Sep 7, 2016, 10:00 AM Pacific Daylight Time
Registration Link: https://cc.readytalk.com/r/ubjhdjz4ewv5&eom
Utility-Scale Solar 2015
Thu, Sep 8, 2016, 10:00 AM Pacific Daylight Time
Registration Link: https://cc.readytalk.com/r/kqwp1gunrb3b&eom
The research was supported by funding from the U.S. Department of Energy SunShot Initiative. The SunShot Initiative is a collaborative national effort that aggressively drives innovation to make solar energy fully cost-competitive with traditional energy sources before the end of the decade. Through SunShot, DOE supports efforts by private companies, universities, and national laboratories to drive down the cost of solar electricity to $0.06 per kilowatt-hour. Learn more at energy.gov/sunshot.
###
Lawrence Berkeley National Laboratory addresses the world’s most urgent scientific challenges by advancing sustainable energy, protecting human health, creating new materials, and revealing the origin and fate of the universe. Founded in 1931, Berkeley Lab’s scientific expertise has been recognized with 13 Nobel prizes. The University of California manages Berkeley Lab for the U.S. Department of Energy’s Office of Science. For more, visit www.lbl.gov.
DOE’s Office of Science is the single largest supporter of basic research in the physical sciences in the United States, and is working to address some of the most pressing challenges of our time. For more information, please visit science.energy.gov.