Contact: Paul Preuss, [email protected]
In 1998 the balloon-borne BOOMERANG and MAXIMA experiments made what were then the highest-resolution measurements of minute variations in the temperature of the cosmic microwave background radiation (CMB). Their high resolution was achieved by scanning small patches of the sky to gather unprecedented volumes of data. The analysis of these datasets presented a significant computational challenge – they were the first CMB datasets to require supercomputing resources.
In 1997 Julian Borrill had arrived at Lawrence Berkeley National Laboratory as a postdoctoral fellow, funded by the Laboratory Directed Research and Development program specifically to develop the high-performance computing tools needed to analyze such CMB datasets. The analysis was performed at the National Energy Research Scientific Computing Center (NERSC) on a 600-processor Cray T3E nicknamed “mcurie,” which at the time was the fifth fastest supercomputer in the world.
“There are three major components in each CMB observation – instrument noise, foreground signals from sources like dust, and the CMB signal itself – which need to be disentangled,” says Borrill. “Because of the correlations in the data, CMB analysis has to be able to manipulate the entire dataset simultaneously and coherently. But the datasets have become so big this is only practical on the most powerful computers.”
Borrill, with colleagues Andrew Jaffe and Radek Stompor, created MADCAP — the Microwave Anisotropy Dataset Computational Analysis Package — and applied it to the BOOMERANG and MAXIMA data to help produce the most detailed maps yet of CMB temperature fluctuations and the angular power spectra that measure the strength of these fluctuations on various angular scales.
The Lab has been at the forefront of CMB data analysis ever since. Borrill – now a staff scientist in the Lab’s Computational Research Division (CRD) – coleads the Computational Cosmology Center (C3), formed in 2007 as a collaboration between CRD and the Physics Division. Its purpose is to forge new algorithms and pioneer new implementations to take optimum advantage of today’s fast-evolving supercomputers, and the unique ability of the cosmic microwave background to probe the fundamental parameters of cosmology and the ultra-high energy physics beyond the Standard Model.
A revolution in the history of the cosmos
The BOOMERANG and MAXIMA results confirmed that the universe is geometrically flat, as predicted by inflation. This result complemented the stunning 1998 discovery, announced by the Supernova Cosmology Project based at Berkeley Lab (and shortly thereafter by the competing High-Z Supernova Search Team), that the expansion of the universe is accelerating because of an unknown something – soon to be named dark energy. Taken together, the supernova and CMB results gave rise to a new concordance cosmology, which holds that about 73 percent of the density of the universe is dark energy, 22 percent is dark matter, and less than 5 percent is ordinary “visible” matter.
“As things stand,” Borrill remarks dryly, noting that no one understands the nature or origin of either dark matter or dark energy, “we have quantified our ignorance to be at the 95-percent level.”

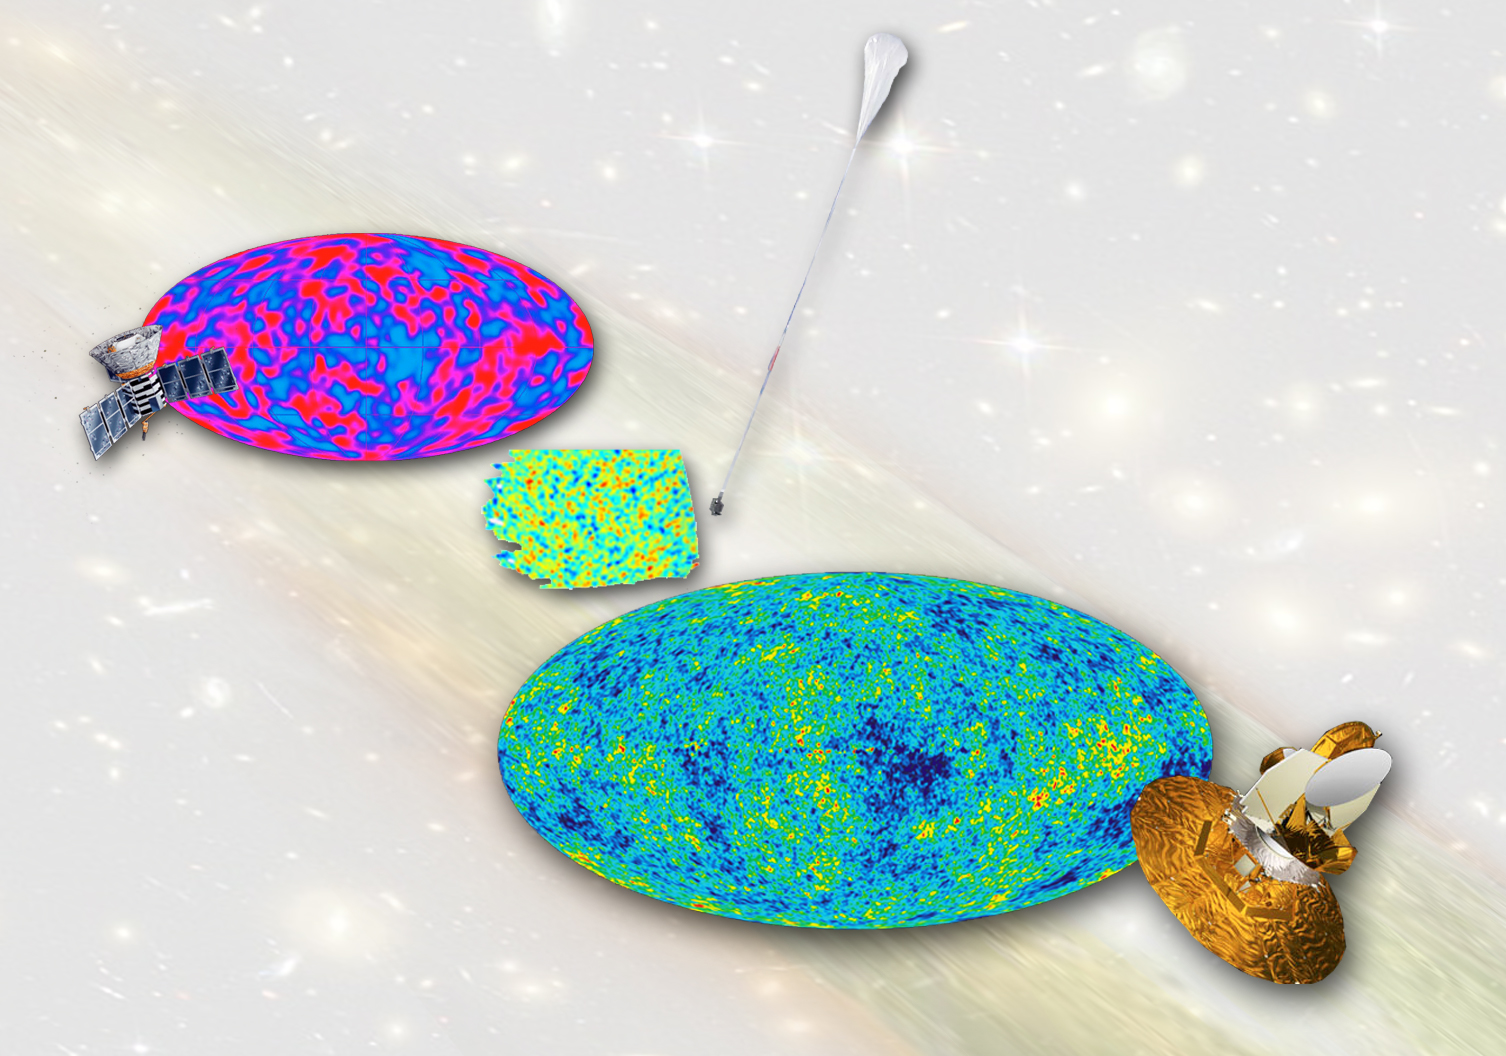
The COBE satellite (upper left) made the first measurements of temperature differences in the cosmic microwave background. BOOMERANG (middle) and MAXIMA mapped smaller portions of the sky but at much higher resolution. With the WMAP satellite’s high-resolution map of the whole CMB sky (lower right), data volume vastly increased once again.
The first measurement of anisotropies in the CMB was by the COBE satellite launched in 1989, an achievement for which Berkeley Lab’s George Smoot won his share of the 2006 Nobel Prize in Physics. BOOMERANG and MAXIMA were a giant step beyond COBE, but much more remained to be uncovered, and in 2001 the WMAP satellite was launched to measure the entire CMB sky at five frequencies, once again achieving new science by dramatically increasing the volume of data needing analysis.
Borrill and his C3 team have been preparing for an even bigger deluge of CMB data that will begin once the Planck satellite, a European Space Agency mission supported by NASA, settles into orbit a few months after its launch in spring, 2009.
“The WMAP data will reach 200 billion samples after its nine-year mission,” Borrill says, “but just a single year of observing by Planck will yield 300 billion samples.” And that’s just the beginning. The balloon-borne EBEX experiment, planned for an Antarctic launch in 2010, will gather 300 billion samples – in just two weeks! The ground-based PolarBeaR telescope will generate 30 trillion samples in three years, and mission concept studies for NASA’s proposed CMBPol satellite aim for 200 trillion samples per year.
“The evolution of CMB detectors and the volume of data they gather mirrors Moore’s Law,” Borrill says, referring to the half-century trend in computer hardware that has seen the density of transistors on a chip double every 18 months or so. “We have to stay on the leading edge of computation just to keep up with CMB data.”
The Planck full focal plane
Already recognized as the world’s leader in providing high-performance computing support for CMB data analysis, NERSC will be home to the U.S. Planck team’s data analysis operations. DOE and NASA have entered an unprecedented interagency agreement guaranteeing a minimum yearly allocation of NERSC resources to Planck through the lifetime of the mission, encompassing both processing time on NERSC’s powerful new Cray XT4 supercomputer (named “Franklin”) and its successors, and data storage on the NERSC global filesystem, which is mounted on all the NERSC systems, removing the need for multiple copies of data files.

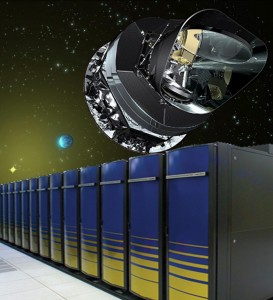
The Planck satellite won’t fly until the spring of 2009, but by using “Franklin,” the Cray XT4 supercomputer at NERSC, Berkeley Lab’s Computational Cosmology Center has successfully simulated the results to be expected from Planck’s first year of observation.
To make sure the Planck data can be analyzed efficiently, Borrill and his team have already simulated the kind and amount of data the satellite is expected to provide. In 2005 they processed a year’s worth of simulated data from the 12 detectors at a single Planck frequency, building 3 x 50-million-pixel maps of the CMB temperature (and two polarization components) from 75 billion simulated observations. By the end of 2007 they had extended their analysis to the entire Planck mission – its “full focal plane” (FFP) – processing 300 billion simulated samples from the satellite’s 74 detectors observing in 9 frequency bands, to build a 23 x 50-million-pixel maps.
One use of the full-focal-plane simulation was to test new methods for accessing and moving data efficiently, since at this scale, input-output (IO) becomes a very significant challenge. To reduce the IO load, Borrill’s team has developed two new twists to their analyses.
“A map pixel is constructed by combining numerous measurements taken at different times by different detectors; we have to know where each of the detectors was pointing when the measurements were made,” Borrill explains. “However, we can calculate the pointing for any particular observation knowing the pointing of the satellite as a whole and the position of the detector in the focal plane. So rather than read the pointing of every single observation from disk, we can read just the satellite pointing and reconstruct each observation’s pointing on the fly.”
This idea gave rise to the Generalized Compressed Pointing library, developed by C3 team member Theodore Kisner. This allowed the Planck FFP simulation to be computed with a dataset occupying only three terabytes (trillion bytes) of disk space; to include individual detector pointings would have required an additional nine terabytes, a dataset four times larger. Even three terabytes is a significant data volume, which will only increase with more complex simulations and future experiments.
The team’s second idea is to remove IO altogether – at least for simulated data. Borrill’s team reasoned that rather than perform a simulation and write the data to disk, only to turn around and read it back in for analysis, why not simulate the data only when it is requested by an analysis application? OTFS, an on-the-fly simulation library developed by C3 team member Christopher Cantalupo, does just this – reducing the disk space and computing time required by these mammoth analyses by orders of magnitude.
Planck is far from the only CMB experiment using NERSC resources; in a given year about a dozen experiments and a hundred analysts (many on more than one team) use a million hours of processor time. Every experiment stores its data in a unique format, but analysis-application programmers would like their tools to be applicable to any experiment’s data. To support this, Borrill’s team have developed the concept of a “data abstraction layer,” implemented by Cantalupo as a central library called M3, which can read any datum from any experiment no matter what its distribution or format.
“With M3 any application programmer can tell the computer ‘go get me this data’ and not have to worry about what file or format it’s in,” Borrill says. “They can even ask for data that doesn’t exist yet, and M3 will use the on-the-fly simulation library to create it.”
In the beginning, CMB missions focused on collecting temperature measurements, with each advance in power (and corresponding increase in data set size) devoted to separating ever-fainter signals from the noise that obscured them. Temperature measurements are the source of the maps from which the first power spectra were derived, revealing the shape of the universe and its mass-energy budget.

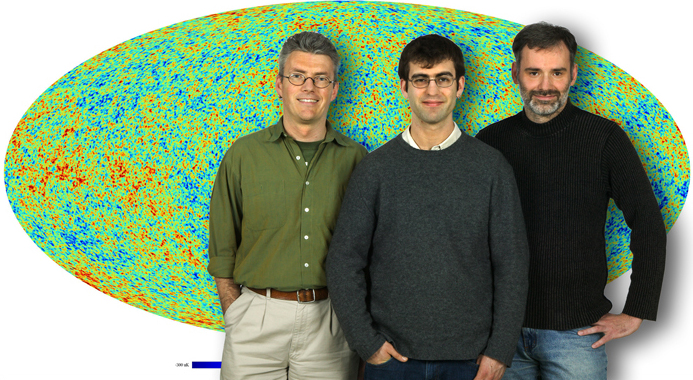
Julian Borrill, Christopher Cantalupo, and Radek Stompor in front of the high-resolution map of the CMB they produced using tens of billions of samples of simulated Planck satellite data (Photo by Roy Kaltschmidt)
But other kinds of signals, much harder to detect, are now coming increasingly within reach. The remnant radiation that constitutes the cosmic microwave background is polarized; some polarization signals, the E-mode, are a result of the same perturbations in the early universe that produced the temperature variations.
Another kind of polarization, called B-mode, is both fainter and more profound in its implications. On the largest scale, B-mode polarization is predicted to derive from gravity waves produced during the inflationary epoch, when the universe expanded exponentially fast just 10-35 second after the big bang.
“Planck will make the definitive CMB temperature measurement; all the experiments that follow Planck will be going after polarization,” Borrill says. “The faintness of the B-mode polarization signals will require frighteningly large data volumes and high performance computing at the peta-scale and beyond. We’re already at work on the algorithms and implementations that we’ll need to handle the data-analysis needs of future generations of CMB experiments at NERSC.”
Additional information
More about “Mapping the Universe” is in DOE’s SciDAC Review at http://www.scidacreview.org/0704/html/cmb.html
More about the Center for Computational Cosmology is at http://c3.lbl.gov/
More about analyzing the data from BOOMERANG and MAXIMA is at http://www.lbl.gov/Science-Articles/Archive/boomerang-flat.html
and at http://www.lbl.gov/Science-Articles/Archive/maxima-results.html
For more about the first Planck simulation read “Simulating a Map of the Cosmic Microwave Background” at http://newscenter.lbl.gov/feature-stories/2005/02/18/simulating-cosmic/
For more about Planck, go to http://www.rssd.esa.int/index.php?project=PLANCK&page=index
For more about EBEX go to http://groups.physics.umn.edu/cosmology/ebex/index.html
For more about PolarBeaR go to http://bolo.berkeley.edu/polarbear/index.html
For more about CMBPol, download the PowerPoint presentation at http://www7.nationalacademies.org/ssb/mtg_2_CMBPol.pdf
Wikipedia’s article on the cosmic microwave background is at http://en.wikipedia.org/wiki/Cosmic_microwave_background_radiation
