
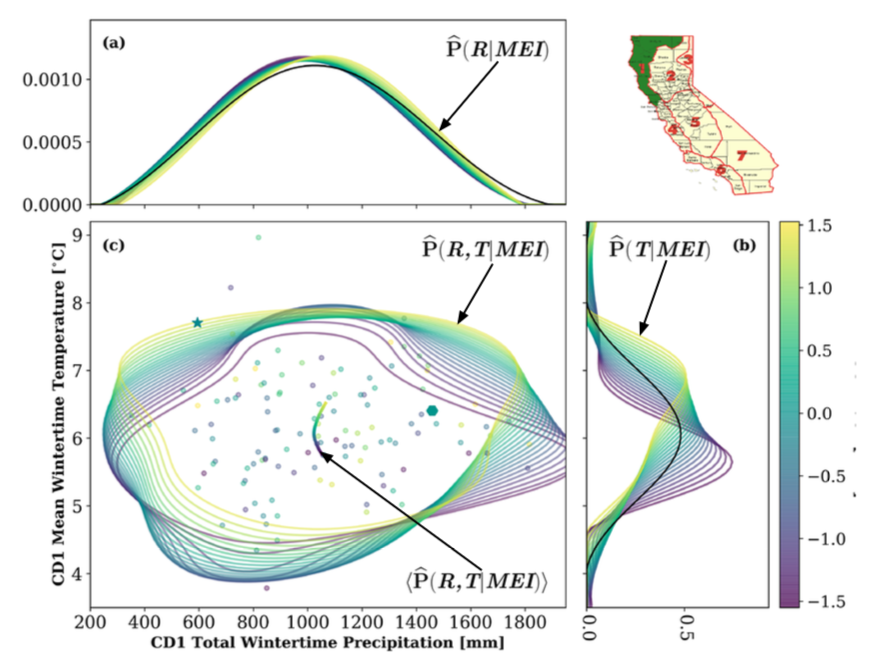
Berkeley Lab researchers have developed a novel analytical method for understanding why and when two extremes, such as heat and drought, happen simultaneously. The method gives a visual representation of the relationships in the form of color-coded joint distribution maps, making it easy to see what variable is driving changes. Using the technique on Northern California winters, they found that El Nino/La Nina winters primarily force changes in temperature (b), and not precipitation (a). Panel (c) shows the conditional joint distribution of temperature and precipitation, with yellow representing El Nino years and purple La Nina. (Credit: Berkeley Lab)
When there are multiple factors at play in a situation that is itself changing, such as an El Nino winter in a changing climate, how can scientists figure out what is causing what? Researchers at Lawrence Berkeley National Laboratory have developed an advanced statistical method for quantifying and visualizing changes in environmental systems and easily picking out the driving factor.
In a new study published in the journal Climate Dynamics, they used their new technique to look at California winters. “A lot of people will describe a winter by how rainy or how cold it was,” said lead author John P. O’Brien, a graduate student research assistant at Berkeley Lab. “Instead of asking each question individually, what we’re doing is interrogating both at the same time as a function of some large-scale climate forcing, such as El Nino.”
The new method allows researchers to account for variables whose statistics change over time – in this case, changes caused by El Nino/La Nina. They found that in northern California, La Nina and El Nino conditions result in nearly equivalent amounts of winter precipitation. However, La Nina winters tend to be much colder, resulting in conditions more favorable for increased mountain snowpack. So from a summer water supply perspective, contrary to common belief, La Nina winters may in fact be preferable to El Nino winters. The same, however, did not hold true for southern California.
Read more about the CASCADE Scientific Focus Area here.