Though 2023 was a relatively slow year for new wind power deployment in the United States, the industry continues to see growth, solid performance, expanding supply chains, and attractive prices, according to a report prepared for the U.S. Department of Energy (DOE) by Lawrence Berkeley National Laboratory (Berkeley Lab).
With power sales prices ranging from less than $20 to more than $40 per megawatt-hour (MWh) for newly built projects, the cost of wind is well below its grid-system, health, and climate value. “Wind energy prices – particularly in the central United States – remain attractive even as they have drifted higher in recent years,” said Ryan Wiser, a senior scientist in Berkeley Lab’s Energy Technologies Area. “Considering the health and climate benefits of wind energy makes the economics even better,” he added.
Key findings from the annual Land-Based Wind Market Report include:
• Wind comprises a significant share of electricity supply. U.S. wind power deployment was relatively low in 2023, totaling 6.5 gigawatts (GW) and representing $10.8 billion in investment. Yet wind energy contributed 10% of the nation’s electricity supply, and as much as 37% in the Southwest Power Pool. A total of 150 GW of wind was installed in the United States at the end of 2023. A record-high 366 GW of wind is seeking transmission interconnection.
• Wind turbines continue to get larger, expanding the market for wind energy. Improved plant performance over the last decades has been driven by larger turbines mounted on taller towers and featuring longer blades. In 2013, no turbines employed rotors that were 115 meters in diameter or larger, whereas 98% of newly installed turbines featured such rotors in 2023.
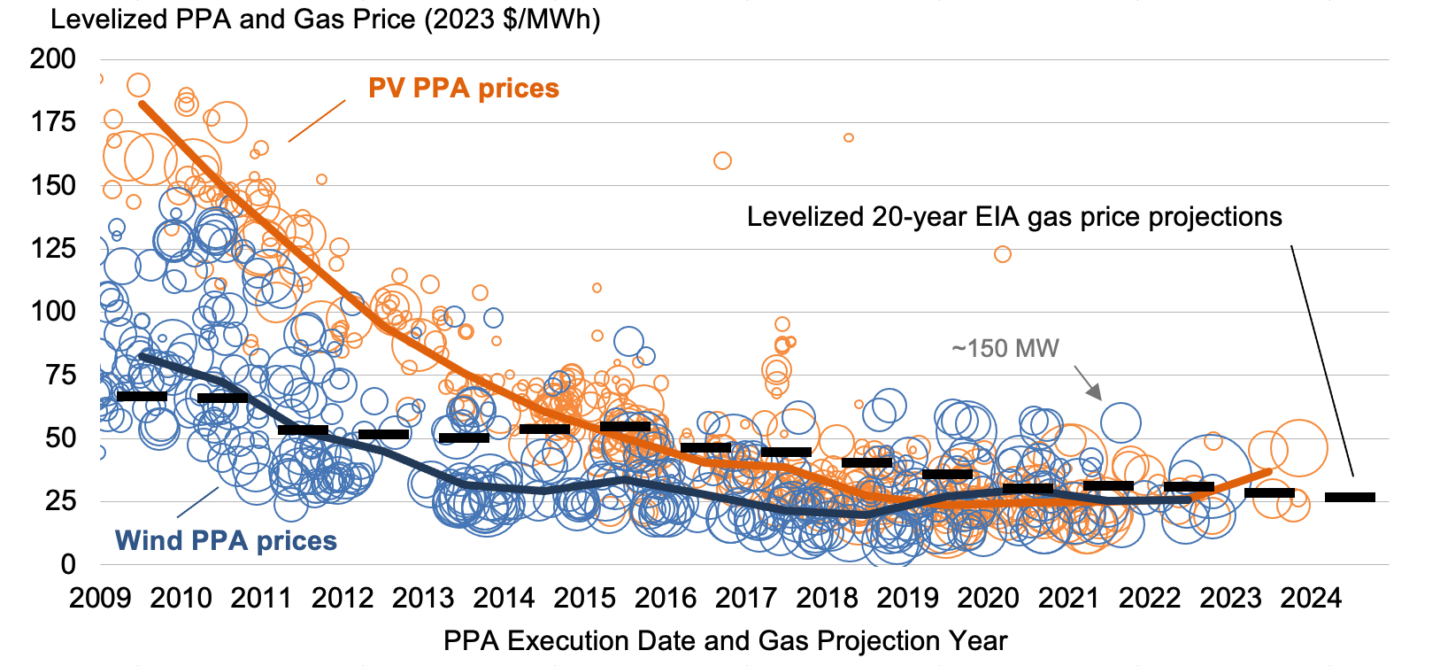
• Wind energy prices have risen but remain attractive for purchasers. Wind power purchase agreement prices have been drifting higher since about 2018, with a recent range from less than $20 per MWh to more than $40 per MWh depending on region and other details. These prices, which are possible in part due to federal tax support, are similar to recent solar sales prices and to the projected future fuel costs of gas-fired generation.
• Wind’s value proposition includes grid and societal benefits. The value of wind in wholesale power markets is affected by the location of wind plants, their hourly output profiles, and how those characteristics correlate with real-time electricity prices and capacity markets. The market value of wind declined in 2023, following a drop in the price of natural gas. Wind also reduces power-sector emissions of carbon dioxide, nitrogen oxides, and sulfur dioxide. These reductions, in turn, provide public health and climate benefits that are larger than wind’s grid-system value. The combination of all three values ($183 per MWh) significantly exceeded the levelized cost of wind energy in 2023.
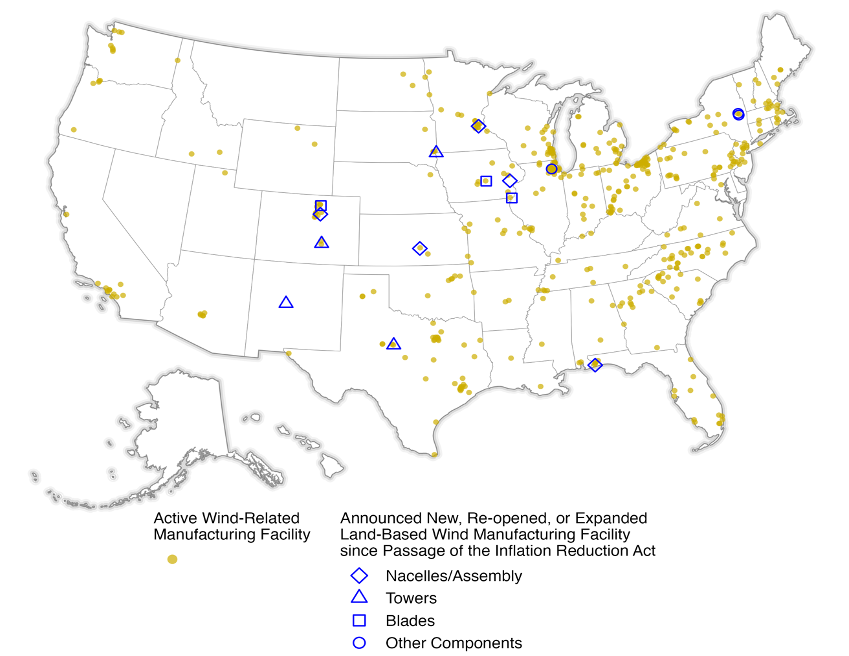 Location of wind turbine and component manufacturing facilities. (Source: U.S. Department of Energy, ACP)
• The Inflation Reduction Act has created renewed optimism for supply chain expansion. Domestic manufacturing of towers and nacelles was strong in 2023, while blade manufacturing has begun to rise after several years of decline. The Inflation Reduction Act contains, for the first time, production-based tax credits for domestic manufacturing of key wind components like nacelles, towers, and blades; it also extended the tax credit for wind deployment, inclusive of a 10% bonus for projects that meet domestic content requirements. Consequently, there have been at least 15 announcements of manufacturing facilities that plan to open, re-open, or expand to serve the land-based wind industry.
• Energy analysts project a resurgence of wind deployment in the years ahead. With a long-term extension of tax credits for wind energy along with opportunities for wind plants to earn two 10% bonus credits, analysts expect 2023 to be the low-point for wind deployment. Forecasts for wind deployment grow to an average over 15 GW per year from 2026 through 2028.
Berkeley Lab’s contributions to this report were funded by the U.S. Department of Energy’s Wind Energy Technologies Office.
Additional Information:
The full Land-Based Wind Market Report: 2024 Edition, a presentation slide deck that summarizes the report, several interactive data visualizations, and an Excel workbook that contains the data presented in the report, can be downloaded from windreport.lbl.gov. Companion reports on offshore wind and distributed wind are also available from the Department of Energy.
The U.S. Department of Energy’s release on this study is available at https://www.energy.gov/eere/wind/wind-energy-market-reports.
###
Lawrence Berkeley National Laboratory (Berkeley Lab) is committed to delivering solutions for humankind through research in clean energy, a healthy planet, and discovery science. Founded in 1931 on the belief that the biggest problems are best addressed by teams, Berkeley Lab and its scientists have been recognized with 16 Nobel Prizes. Researchers from around the world rely on the lab’s world-class scientific facilities for their own pioneering research. Berkeley Lab is a multiprogram national laboratory managed by the University of California for the U.S. Department of Energy’s Office of Science.
DOE’s Office of Science is the single largest supporter of basic research in the physical sciences in the United States, and is working to address some of the most pressing challenges of our time. For more information, please visit energy.gov/science.
