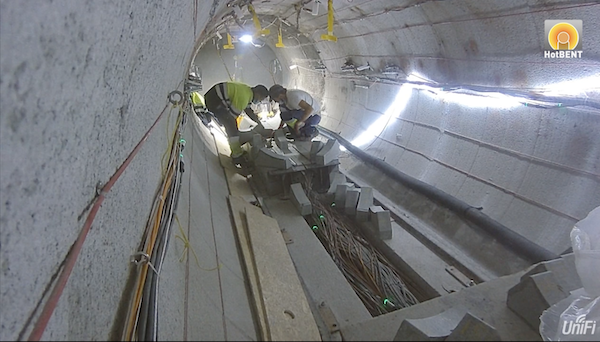
Sean Lubner (right), Mechanical Research, Scientist/Engineer, Energy Storage & Distributed Resources Division (ESDR), and Yuqiang Zhen, Staff, ESDR, utilizing 3ω for thermal characterization of batteries at the Thermal Science Group laboratory. A chart that shows projected changes in annual maximum temperature (top row) and annual minimum temperature (bottom) at three levels of global warming in the world, compared to the 1851-1900 baseline, based on computer simulations. Graphic collage of a person standing in front of a computer and microchips Quantification of the U.S. building-grid resource infographic. Load reductions, Spatio-temporal variation, Impactful measures. magnet This color-enhanced image, taken by scanning electron microscopy, shows huge quantities of SARS-CoV-2 particles (purple) that have burst out of kidney cells (green), which the virus hijacked for replication. The bulging, spherical cells in the upper-right and bottom-left corners are distorted and about to burst from the viral particles inside, and are beginning to self-destruct. (Credit: NIAID Integrated Research Facility) A map showing clusters of microbes found across the world Detailed X-ray measurements at the Advanced Light Source helped a research team co-led by Berkeley Lab, SLAC, and Stanford University reveal how oxygen seeps out of the billions of nanoparticles that make up lithium-ion battery electrodes. (Credit: Berkeley Lab) Three-dimensional drawing of electrode molecular surface, with gas molecules above and a yellow arrow representing incoming X-rays.